Chad has a hot and generally dry climate, but conditions change dramatically from north to south. The north lies deep within the Sahara and receives very little rainfall, while the south has a much wetter tropical climate with a pronounced rainy season.
Chad’s climate at a glance
Warmest average month

May
32.0°C (89.6°F)
Coolest average month

January
21.0°C (69.8°F)
Wettest month nationally
August
120.0 mm (4.72 in)
Driest month nationally

January
0.5 mm (0.02 in)
Temperature and precipitation figures are from CRU-CY v4.10, Climatic Research Unit, University of East Anglia. National averages for 1991–2020.
What is the climate of Chad?
Chad has a pronounced north–south climate gradient.
Northern Chad lies within the Sahara and is extremely dry. Around Faya-Largeau, the largest city in northern Chad, historical climate data show annual rainfall of only about 12 mm (0.5 in), and very high temperatures are common during the hottest part of the year.
Central Chad lies largely within the Sahel, a transition zone between the Sahara and the wetter south. Around N’Djamena, rainfall is concentrated mainly between June and September, with historical station data showing roughly 510 mm (20 in) annually.
Southern Chad is considerably wetter. Around Moundou, historical annual rainfall is around 1,000 mm (39 in), with most rain falling between about May and October.
This creates three broad climate regions: the extremely dry Saharan north, the semi-arid Sahel across the center, and the wetter tropical savanna of southern Chad.
Climate types in Chad
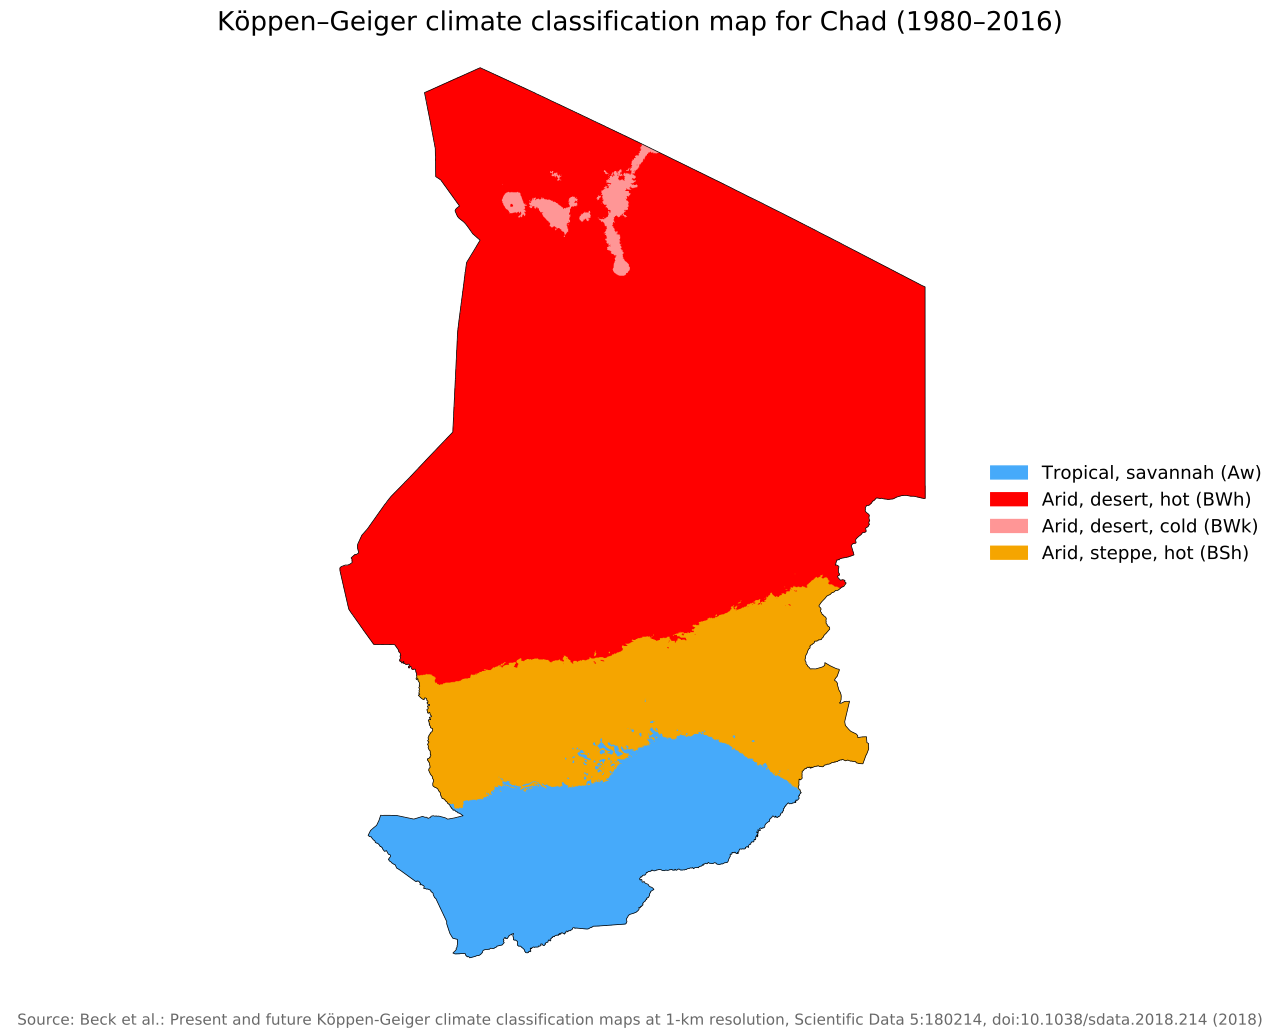
Chad shows a very clear north–south climate pattern. Most of the north and center has a hot desert climate, while a hot semi-arid climate forms a broad belt across the south-central part of the country.
Farther south, this gives way to a tropical savanna climate, which covers most of southern Chad. The map also shows a few small patches of cold desert climate in the far north. Overall, the climate zones appear to become less arid toward the south.
Temperatures in Chad
Chad remains warm to extremely hot throughout the year, although temperatures change considerably between the cooler months and the hottest period from April to June.
Data for 1991–2020 show national average temperatures ranging from 21.0°C (69.8°F) in January to 32.0°C (89.6°F) in May.
The hottest daytime conditions occur during April, May and June. Average maximum temperatures reach 39.7°C (103.5°F) in May, while April and June also average close to 39°C (102°F).
Temperatures peak in May, before gradually decreasing through the wetter months. By August, the national average declines to 29.0°C (84.2°F).
| Month | Avg. minimum | Avg. temperature | Avg. maximum |
|---|---|---|---|
| January | 12.5 °C (54.5 °F) | 21.0 °C (69.8 °F) | 29.7 °C (85.5 °F) |
| February | 14.9 °C (58.8 °F) | 23.7 °C (74.7 °F) | 32.5 °C (90.5 °F) |
| March | 19.0 °C (66.2 °F) | 27.4 °C (81.3 °F) | 35.9 °C (96.6 °F) |
| April | 22.7 °C (72.9 °F) | 30.9 °C (87.6 °F) | 39.1 °C (102.4 °F) |
| May | 24.3 °C (75.7 °F) | 32.0 °C (89.6 °F) | 39.7 °C (103.5 °F) |
| June | 24.6 °C (76.3 °F) | 31.7 °C (89.1 °F) | 38.9 °C (102.0 °F) |
| July | 24.1 °C (75.4 °F) | 30.2 °C (86.4 °F) | 36.4 °C (97.5 °F) |
| August | 23.2 °C (73.8 °F) | 29.0 °C (84.2 °F) | 34.8 °C (94.6 °F) |
| September | 22.7 °C (72.9 °F) | 29.5 °C (85.1 °F) | 36.2 °C (97.2 °F) |
| October | 20.7 °C (69.3 °F) | 28.4 °C (83.1 °F) | 36.1 °C (97.0 °F) |
| November | 16.5 °C (61.7 °F) | 24.8 °C (76.6 °F) | 33.2 °C (91.8 °F) |
| December | 13.4 °C (56.1 °F) | 22.0 °C (71.6 °F) | 30.5 °C (86.9 °F) |
Nights are considerably cooler during the winter months, especially in northern Chad. Average minimum temperatures fall to 12.5°C (54.5°F) in January, compared with 24.6°C (76.3°F) in June.
Rainfall in Chad
Rainfall in Chad is highly seasonal and extremely uneven across the country.
National data for 1991–2020 show almost no rainfall during the beginning and end of the year. January averages just 0.5 mm (0.02 in), while February and December each receive only 0.6 mm (0.02 in).
| Month | Precipitation |
|---|---|
| January | 0.5 mm (0.02 in) |
| February | 0.6 mm (0.02 in) |
| March | 1.6 mm (0.06 in) |
| April | 6.0 mm (0.24 in) |
| May | 20.1 mm (0.79 in) |
| June | 30.9 mm (1.22 in) |
| July | 76.9 mm (3.03 in) |
| August | 120.0 mm (4.72 in) |
| September | 58.1 mm (2.29 in) |
| October | 16.9 mm (0.67 in) |
| November | 1.0 mm (0.04 in) |
| December | 0.6 mm (0.02 in) |
Rainfall begins increasing during May and June before rising sharply in July. August is the wettest month nationally, averaging 120.0 mm (4.72 in), followed by September at 58.1 mm (2.29 in).
The monthly figures total only about 333 mm (13.1 in) annually across Chad as a whole, but this national average is strongly influenced by the enormous, almost rainless Saharan north. Rainfall is far higher in southern Chad.
Rainy and dry seasons in Chad
The length of Chad’s rainy season changes dramatically from south to north.
In southern Chad, the rainy season generally lasts from around May to October. Across the central Sahel, it is shorter and is concentrated mainly between June and September. Northern desert areas receive very little rainfall throughout the year.
Much of Chad is extremely dry between November and March, when almost no rain falls across large parts of the country.
The seasonal rains are controlled largely by the northward and southward movement of the tropical rain belt. Changes in how far this rain belt moves from one year to another can cause substantial differences in rainfall between years.
How is Chad’s climate changing?
Chad has already experienced significant warming. Since 1950, average minimum temperatures have increased by around 0.5–1.7°C (0.9–3.1°F) at different weather stations, while average annual maximum temperatures have risen by about 1.34°C (2.4°F).
Temperatures are expected to continue rising over the coming decades.
Changes in rainfall are more uncertain because precipitation naturally varies considerably from year to year. Recent climate projections generally suggest that average rainfall could increase in Chad, but extreme rainfall is also expected to become more intense, increasing the risk of severe flooding.
Drought will remain an important risk, particularly as higher temperatures increase evaporation even if total rainfall increases.
Reference
Harris I, Osborn TJ, Jones P and Lister D (2020) Version 4 of the CRU TS Monthly High-Resolution Gridded Multivariate Climate Dataset. Sci Data 7, 109. https://doi.org/10.1038/s41597-020-0453-3.

Caitriona Maria is an education writer and owner of The Facts Institute. With seven years of teaching experience and a background in educational content, she specialises in creating clear reference resources about countries, geography and global topics.