Burundi has a generally mild tropical climate, with temperatures moderated by the country’s high elevation. Rain falls during much of the year, although there is a pronounced dry season from around June to August.
Burundi’s climate at a glance
Warmest average month

September
20.9°C (69.6°F)
Coolest average month

July
19.2°C (66.6°F)
Wettest month nationally

November
164.8 mm (6.49 in)
Driest month nationally

July
5.3 mm (0.21 in)
Temperature and precipitation figures are from CRU-CY v4.10, Climatic Research Unit, University of East Anglia. National averages for 1991–2020.
What is the climate of Burundi?
Burundi lies close to the Equator in Eastern Africa, but much of the country is elevated, which keeps temperatures considerably milder than might otherwise be expected at this latitude.
Elevation ranges from around 775 metres (2,543 ft) near Lake Tanganyika to 2,684 metres (8,806 ft) at Mount Heha. As a result, temperatures noticeably differ between the country’s lowlands and highlands.
Around the central plateau, average annual temperatures are about 21°C (70°F). Lower areas around Bujumbura and Lake Tanganyika are warmer, averaging around 23°C (73°F), while some higher-altitude areas average closer to 16°C (61°F).
Rainfall also changes with elevation. Higher areas can receive around 1,500–1,800 mm (59–71 in) annually, while rainfall falls to around 1,000 mm (39 in) near Lake Tanganyika and in some lower-lying areas.
Climate types in Burundi
This map shows the main climate types found across Burundi. Each color represents a different climate type, based mainly on long-term patterns of temperature and rainfall.
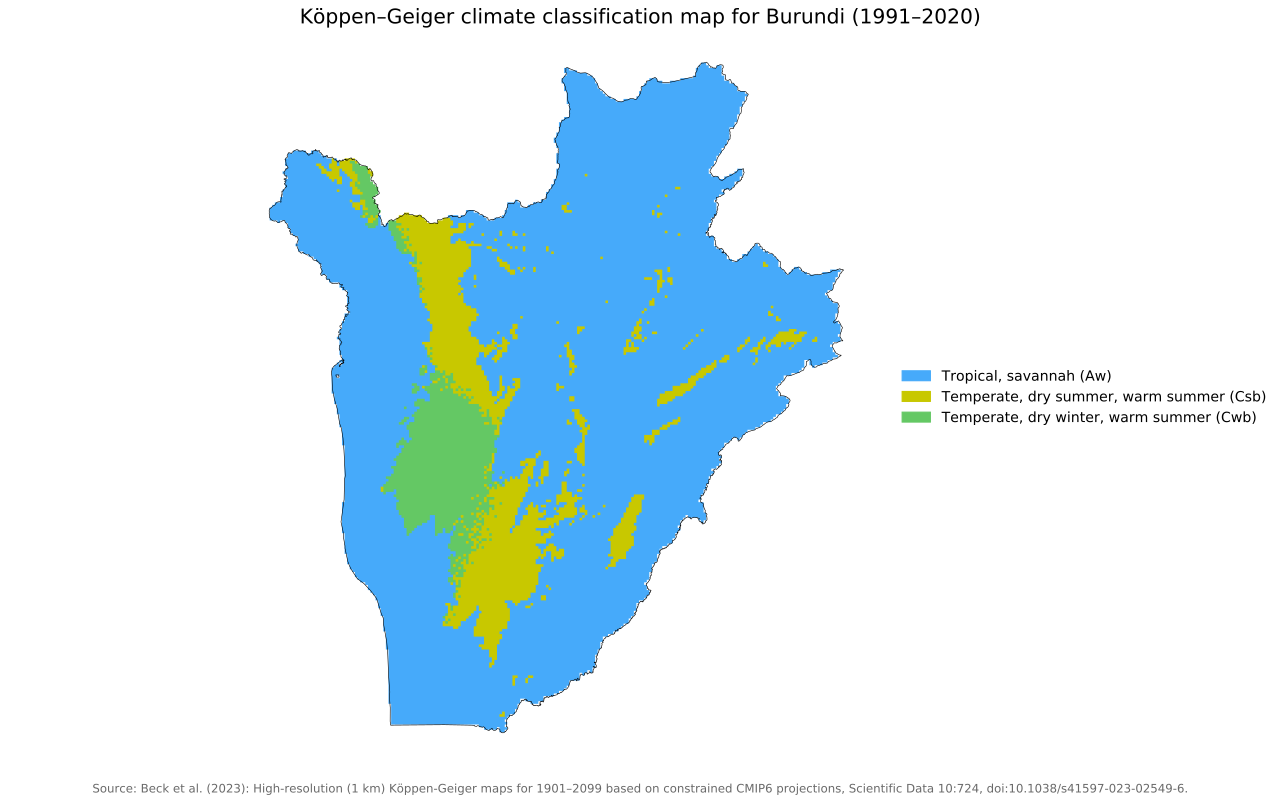
Most of Burundi has a tropical savanna climate, which covers much of the north, east and south of the country.
A warm-summer Mediterranean climate appears mainly in a broken north–south belt through the western and central parts of Burundi, with some smaller patches farther east.
A subtropical highland climate with dry winters is concentrated more heavily in the west-central and southwestern parts of the country.
Temperatures in Burundi
Burundi experiences relatively little change in average temperature through the year.
Data for 1991–2020 show national average temperatures stay fairly consistent throughout the year, ranging from just 19.2°C (66.6°F) in July to 20.9°C (69.6°F) in September.
Daytime maximum temperatures are highest in August and September, averaging around 28°C (82°F). The coolest nights occur during the main dry season, with average minimum temperatures falling to 11.8°C (53.2°F) in July.
| Month | Avg. minimum | Avg. temperature | Avg. maximum |
|---|---|---|---|
| January | 14.1 °C (57.4 °F) | 19.9 °C (67.8 °F) | 25.8 °C (78.4 °F) |
| February | 14.3 °C (57.7 °F) | 20.3 °C (68.5 °F) | 26.3 °C (79.3 °F) |
| March | 14.2 °C (57.6 °F) | 20.2 °C (68.4 °F) | 26.1 °C (79.0 °F) |
| April | 14.5 °C (58.1 °F) | 20.0 °C (68.0 °F) | 25.7 °C (78.3 °F) |
| May | 14.2 °C (57.6 °F) | 19.8 °C (67.6 °F) | 25.5 °C (77.9 °F) |
| June | 12.7 °C (54.9 °F) | 19.4 °C (66.9 °F) | 26.1 °C (79.0 °F) |
| July | 11.8 °C (53.2 °F) | 19.2 °C (66.6 °F) | 26.6 °C (79.9 °F) |
| August | 13.1 °C (55.6 °F) | 20.6 °C (69.1 °F) | 28.1 °C (82.6 °F) |
| September | 13.9 °C (57.0 °F) | 20.9 °C (69.6 °F) | 28.0 °C (82.4 °F) |
| October | 14.2 °C (57.6 °F) | 20.8 °C (69.4 °F) | 27.5 °C (81.5 °F) |
| November | 14.0 °C (57.2 °F) | 20.1 °C (68.2 °F) | 26.2 °C (79.2 °F) |
| December | 14.1 °C (57.4 °F) | 19.8 °C (67.6 °F) | 25.6 °C (78.1 °F) |
Elevation creates much larger differences across Burundi than the changing seasons do. Lower areas around Lake Tanganyika are generally warmer, while temperatures become progressively cooler in the highlands.
Rainfall in Burundi
Rainfall in Burundi is distributed across much of the year, but there is a very pronounced dry period during the middle of the year.
National data for 1991–2020 show precipitation falling sharply from 93.7 mm (3.69 in) in May to only 14.3 mm (0.56 in) in June. July is the driest month, averaging just 5.3 mm (0.21 in).
| Month | Precipitation |
|---|---|
| January | 156.2 mm (6.15 in) |
| February | 117.4 mm (4.62 in) |
| March | 162.9 mm (6.41 in) |
| April | 148.0 mm (5.83 in) |
| May | 93.7 mm (3.69 in) |
| June | 14.3 mm (0.56 in) |
| July | 5.3 mm (0.21 in) |
| August | 15.7 mm (0.62 in) |
| September | 65.7 mm (2.59 in) |
| October | 107.7 mm (4.24 in) |
| November | 164.8 mm (6.49 in) |
| December | 147.9 mm (5.82 in) |
Rainfall begins increasing again in September and becomes much heavier from October onward. November is the wettest month nationally, averaging 164.8 mm (6.49 in), while January, March, April and December are also relatively wet. Rainfall is considerably higher in some elevated parts of the country.
Rainy and dry seasons in Burundi
Burundi’s main dry season occurs from around June to August, when rainfall becomes very scarce across much of the country.
The wetter part of the year is less uniform. Rainfall generally increases again from September, with particularly wet conditions from October through December and again during the first part of the following year.
Some descriptions of Burundi’s climate also identify a shorter drier period around January and February, although this is much less pronounced than the main mid-year dry season and is not clearly visible in the national 1991–2020 rainfall averages.
How is Burundi’s climate changing?
Burundi is expected to become considerably warmer as the climate changes. Regional climate projections covering Burundi suggest an increase in average temperature of around 1.4–2.7°C (2.5–4.9°F) by the middle of the century, depending on future emissions.
Changes in total rainfall are less certain. Most projections suggest only relatively small changes in annual precipitation, with some indicating a slight increase.
More significant changes may occur in the way rain falls. Dry spells during the rainy season are projected to become more common, while heavy rainfall events are expected to become more intense. This could increase the risk of both drought-related problems and flooding even if total annual rainfall changes relatively little.
Reference
Harris I, Osborn TJ, Jones P and Lister D (2020) Version 4 of the CRU TS Monthly High-Resolution Gridded Multivariate Climate Dataset. Sci Data 7, 109. https://doi.org/10.1038/s41597-020-0453-3.

Caitriona Maria is an education writer and owner of The Facts Institute. With seven years of teaching experience and a background in educational content, she specialises in creating clear reference resources about countries, geography and global topics.