Burkina Faso has a hot climate with a distinct rainy season and a long dry season. Rainfall increases considerably from the dry Sahelian north toward the wetter south, while temperatures remain high throughout the year.
Burkina Faso’s climate at a glance
Warmest average month
April
33.8°C (92.8°F)
Coolest average month

January
25.6°C (78.1°F)
Wettest month nationally
August
237.1 mm (9.33 in)
Driest month nationally

December
0.2 mm
(0.01 in)
Main rainy period

May–October
Main dry
period

November–April
Temperature and precipitation figures are from CRU-CY v4.10, Climatic Research Unit, University of East Anglia. National averages for 1991–2020.
What is the climate of Burkina Faso?
Burkina Faso’s climate becomes progressively wetter from north to south.
The northern part of the country lies within the Sahelian zone, where annual rainfall is generally below 600 mm (24 in). Central Burkina Faso lies mainly within the North-Sudanian zone, which typically receives around 600–900 mm (24–35 in) annually. Farther south, the South-Sudanian zone receives more than 900 mm (35 in) in an average year.
This creates substantial differences across the country. Areas around Dori in the north are much drier than central Burkina Faso around Ouagadougou, while the southwest around Bobo-Dioulasso lies within the wetter southern part of the country.
Burkina Faso also has a strongly seasonal climate. Rainfall is concentrated into only part of the year, while the remaining months are generally very dry. During the dry season, the harmattan can bring hot, dry and dusty air southward from the Sahara.
Climate types in Burkina Faso
This map shows the main climate types found across Burkina Faso. Each color represents a different climate type, based mainly on long-term patterns of temperature and rainfall.
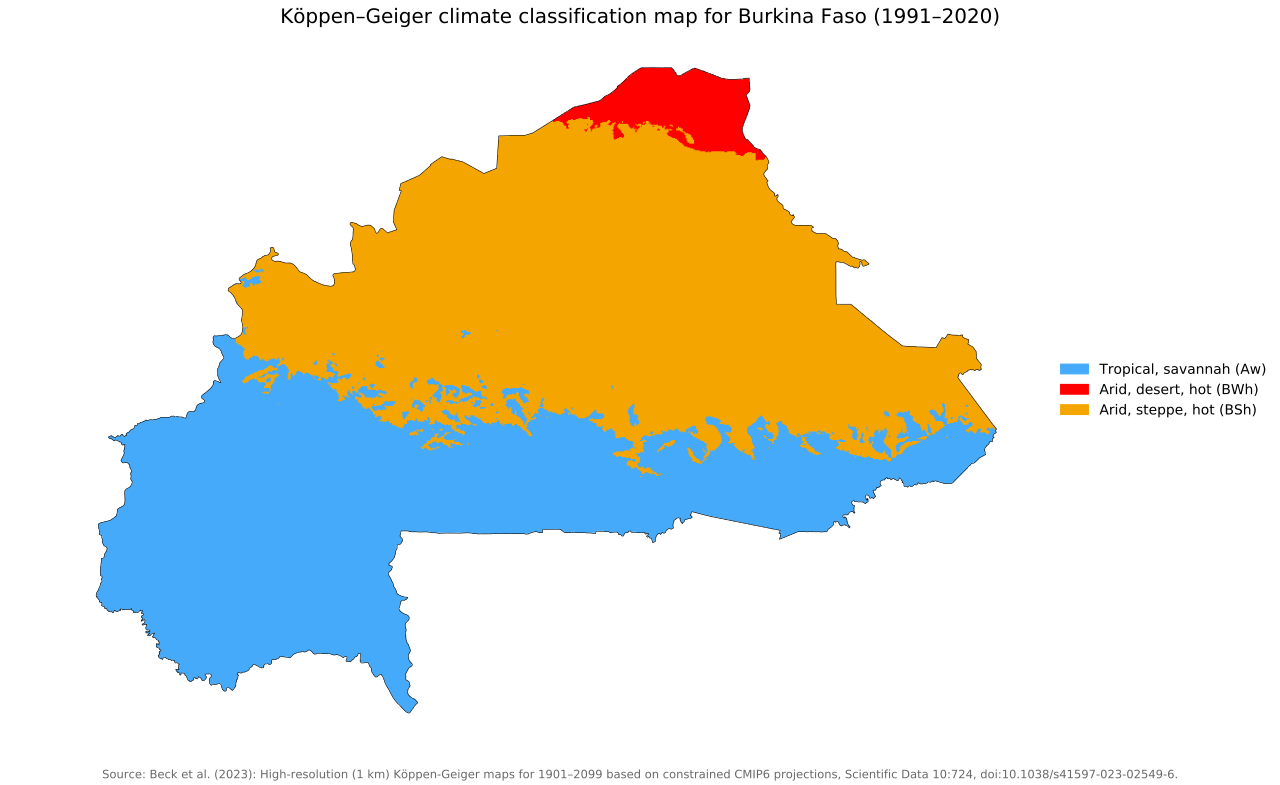
Southern Burkina Faso has a tropical savanna climate, which covers a broad band across the south of the country. Farther north, this gives way to a hot semi-arid climate, which covers much of central and northern Burkina Faso.
A hot desert climate appears in the far north, close to the country’s northern border.
Temperatures in Burkina Faso
Burkina Faso remains hot throughout the year, although temperatures change noticeably with the seasons.
Data for 1991–2020 show national average temperatures ranging from 25.6°C (78.1°F) in January to 33.8°C (92.8°F) in April. The hottest conditions occur shortly before the main rains become established, with average daytime maximum temperatures reaching 40.3°C (104.5°F) in April.
By August, rainfall reaches its annual peak and the national average temperature falls to 27.4°C (81.3°F), with an average daytime maximum of 31.7°C (89.1°F).
Nights are coolest around the beginning and end of the year. Average minimum temperatures fall to 18.1°C (64.6°F) in January, compared with 27.4°C (81.3°F) in May.
| Month | Avg. minimum | Avg. temperature | Avg. maximum |
|---|---|---|---|
| January | 18.1 °C (64.6 °F) | 25.6 °C (78.1 °F) | 33.1 °C (91.6 °F) |
| February | 21.1 °C (70.0 °F) | 28.6 °C (83.5 °F) | 36.2 °C (97.2 °F) |
| March | 25.1 °C (77.2 °F) | 32.2 °C (90.0 °F) | 39.3 °C (102.7 °F) |
| April | 27.2 °C (81.0 °F) | 33.8 °C (92.8 °F) | 40.3 °C (104.5 °F) |
| May | 27.4 °C (81.3 °F) | 33.0 °C (91.4 °F) | 38.7 °C (101.7 °F) |
| June | 25.5 °C (77.9 °F) | 30.5 °C (86.9 °F) | 35.7 °C (96.3 °F) |
| July | 23.9 °C (75.0 °F) | 28.4 °C (83.1 °F) | 33.0 °C (91.4 °F) |
| August | 23.2 °C (73.8 °F) | 27.4 °C (81.3 °F) | 31.7 °C (89.1 °F) |
| September | 23.4 °C (74.1 °F) | 28.3 °C (82.9 °F) | 33.1 °C (91.6 °F) |
| October | 23.7 °C (74.7 °F) | 29.9 °C (85.8 °F) | 36.1 °C (97.0 °F) |
| November | 21.2 °C (70.2 °F) | 28.9 °C (84.0 °F) | 36.7 °C (98.1 °F) |
| December | 18.6 °C (65.5 °F) | 26.2 °C (79.2 °F) | 33.8 °C (92.8 °F) |
Rainfall in Burkina Faso
Rainfall in Burkina Faso is highly seasonal, with very little precipitation during much of the dry season.
National data for 1991–2020 show rainfall averaging just 0.2 mm (0.01 in) in December and 0.4 mm (0.02 in) in January. Rainfall begins increasing during April and May before rising sharply from June onward.
| Month | Precipitation |
|---|---|
| January | 0.4 mm (0.02 in) |
| February | 1.3 mm (0.05 in) |
| March | 5.7 mm (0.22 in) |
| April | 26.1 mm (1.03 in) |
| May | 61.0 mm (2.40 in) |
| June | 105.2 mm (4.14 in) |
| July | 174.1 mm (6.85 in) |
| August | 237.1 mm (9.33 in) |
| September | 141.6 mm (5.57 in) |
| October | 46.1 mm (1.81 in) |
| November | 3.1 mm (0.12 in) |
| December | 0.2 mm (0.01 in) |
August is by far the wettest month nationally, averaging 237.1 mm (9.33 in). Rainfall remains high in September before decreasing rapidly through October and November.
The monthly figures add up to roughly 802 mm (31.6 in) per year nationally, but this average hides a large geographical difference. Northern Burkina Faso generally receives less than 600 mm (24 in) annually, while parts of the south receive more than 900 mm (35 in).
Rainy and dry seasons in Burkina Faso
The length of Burkina Faso’s rainy season changes considerably from south to north.
In the southwest, the rains can begin around late March or April and last for several months. They reach central Burkina Faso later, generally during May and June. In the far north, the rainy season may not become established until June or early July and can last only around two months.
The remainder of the year is dominated by the dry season. The dry period is longest in northern Burkina Faso, where the influence of the Sahara is strongest and annual rainfall is lowest.
How is Burkina Faso’s climate changing?
Burkina Faso is expected to become hotter and potentially drier as the climate changes. Temperatures are projected to rise by around 1.7°C (3.1°F) by 2050, while rainfall could decrease by about 7.3%.
Greater changes in rainfall could increase the risk of drought and water shortages, while higher temperatures may increase evaporation and the risk of forest and bushfires.
Reference
Harris I, Osborn TJ, Jones P and Lister D (2020) Version 4 of the CRU TS Monthly High-Resolution Gridded Multivariate Climate Dataset. Sci Data 7, 109. https://doi.org/10.1038/s41597-020-0453-3.

Caitriona Maria is an education writer and owner of The Facts Institute. With seven years of teaching experience and a background in educational content, she specialises in creating clear reference resources about countries, geography and global topics.